Personalized care from orthopedic trauma experts
Treatment for severe musculoskeletal injuries
Florida Orthopaedic Institute has provided leading orthopedic care for severe musculoskeletal injuries since 1987. Our trauma program consists of fellowship-trained orthopedic traumatologists who provide emergency room care at Blake Regional Hospital, Brandon Regional Hospital, Lakeland Regional Hospital, St. Joseph’s Hospital and Tampa General Hospital, the only Level 1 trauma center in West Florida.
When you have a musculoskeletal injury that requires prompt care, such as a torn Achilles tendon, fractured ligament, or torn rotator cuff, you need to be seen by an orthopedic specialist immediately. At Florida Orthopaedic Institute, our physicians are committed to providing the highest level of care for you in the most efficient and timely manner.
Orthopaedic Trauma Service
5 Tampa General Circle, Suite 710
Tampa, FL 33606
(813) 253-2068
(813) 254-4113 (fax)
Florida Orthopaedic Institute
(OTS is a division of Florida Orthopaedic Institute)
13020 Telecom Parkway N
Tampa, FL 33637
(813) 978-9700
Learn more about
Orthopedic trauma care team


Common trauma services
- Deformity Correction
- Diagnostic Imaging
- Foot & Ankle Reconstruction
- Fracture Repair
- Hip Reconstruction
- Infections
- Orthopedic Trauma Care
- Orthopedic Urgent Care
- Pain Management
About Orthopaedic Trauma Service (OTS)
The Orthopaedic Trauma Service (OTS) is a division of the Florida Orthopaedic Institute and is affiliated with the Orthopaedic Department and Residency Program at the University of South Florida.
The Orthopaedic Trauma Service consists of fellowship-trained orthopedic trauma surgeons and provides all orthopedic trauma coverage at Tampa General Hospital, the only American College of Surgeons designated Level 1 trauma center in West Central Florida, as well as at several other state designated Level 2 trauma centers.
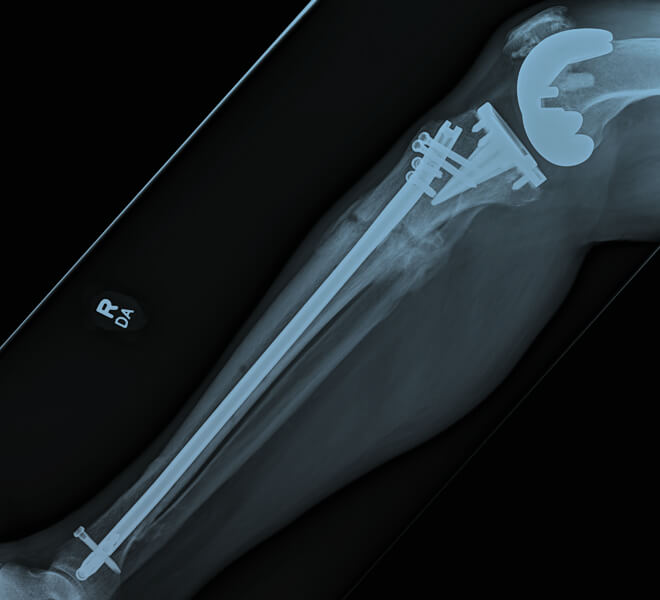
The Orthopaedic Trauma Service provides expert care for patients with severe musculoskeletal injuries, specializing in the care of fractures and fracture-related problems, including nonunions, malunions, post-traumatic arthritis, deformity correction, infections, pelvis/hip reconstruction, and foot/ankle reconstruction.
The Orthopaedic Trauma Service has consistently offered one of the nation’s premiere fellowships in orthopedic trauma for more than thirty years. Areas of emphasis include clinical management, technical excellence, education, research, and continuous quality improvement.
Learn More About OTS Fellowship Program
Team
Research
Hassan Mir, MD, MBA, Research Director
Lisa Stang, BSN, RN, CCRP, Research Nurse Coordinator
Joanna Mullins, RN, BSN, Research Nurse
Mir Ibrahim Sajid, MD, Research Fellow
Administration
Joanna Mullins, RN, BSN, Fellowship Coordinator
Journal of Orthopaedic Trauma
Michele Zimmerman, RN, Managing Editor
University of South Florida – Residency Program
Nikki Rives, Residency Coordinator
“As far as Dr. Mir and Florida Orthopaedic Institute, I can’t say enough. They literally bring tears to my eyes. I’ve never seen that kind of care in my life, and I couldn’t ask for anything more.” Alan McEwen | Bull Riding Accident